Visualization
Introduction
Vector field visualization is a major discipline of scientific visualization that helps to push the frontiers of research in fluid mechanics, medicine, biology, astrophysics and many more. Our goal is to develop novel algorithms that help to extract features in flows, such as vortices or separating structures. We improve the rendering quality to increase the reliability of the obtained visualizations, and we put the users first to let them emphasize and discover certain structures of interest. We investigate the properties of traditional flows such as gases and fluids, as well as higher-dimensional flows that describe the motion of finite-sized objects carried by fluids, also known as inertial particles.
Topics
Feature Extraction in Unsteady Flows
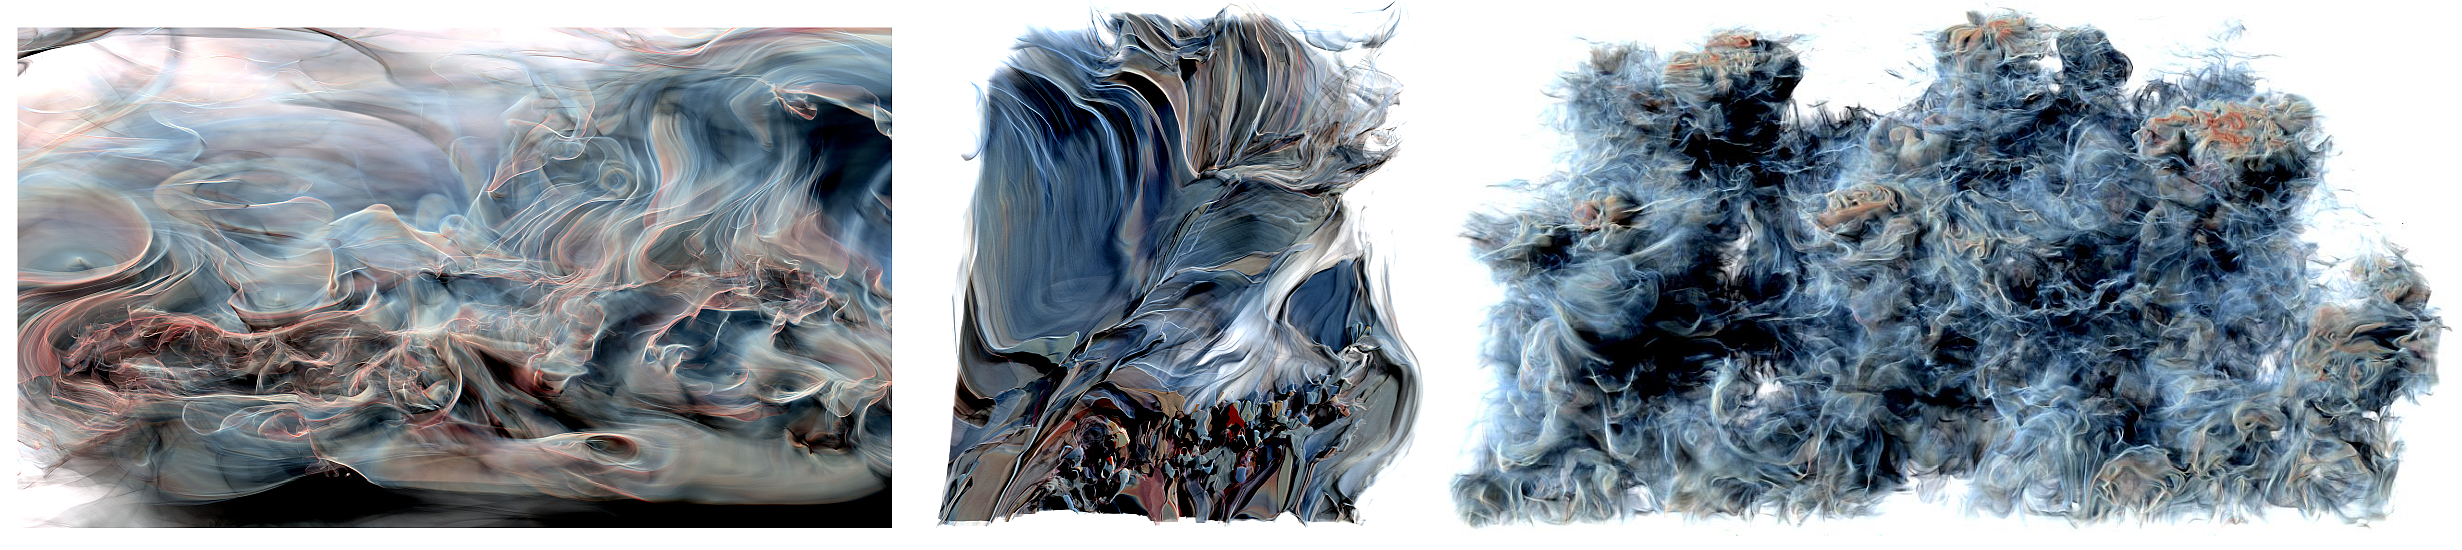
Our research is dedicated to novel extraction and rendering techniques for the visualization of features in unsteady flows. For this, we apply techniques from light transport in heterogeneous participating media to the unbiased rendering of features in Lagrangian scalar fields. An example in atmospheric flows are the ridges of the finite-time Lyapunov exponent (FTLE), which constrain the advection of trace gases, guide temperature diffusion, and cloud formation.
Inertial Particle Dynamics
Recent research in flow visualization focused on the analysis of massless particles. However, in many application scenarios, the mass of particles and their resulting inertia are essential, for instance when sand particles interact with aircraft. The governing ordinary differential equation of even simple inertial flow models is up to seven dimensional, which makes feature extraction a challenging task. We extract and visualize integral geometry, study the vortical motion and separation behavior of inertial particles, and extend traditional vector field topology to the inertial case.
Optimal Reference Frames for Vortex Extraction
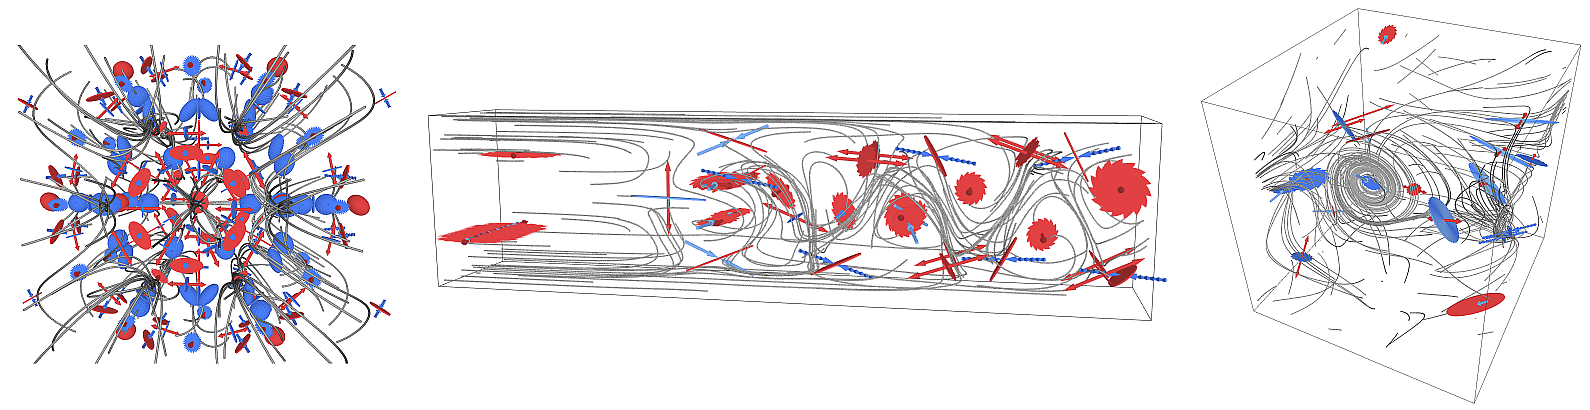
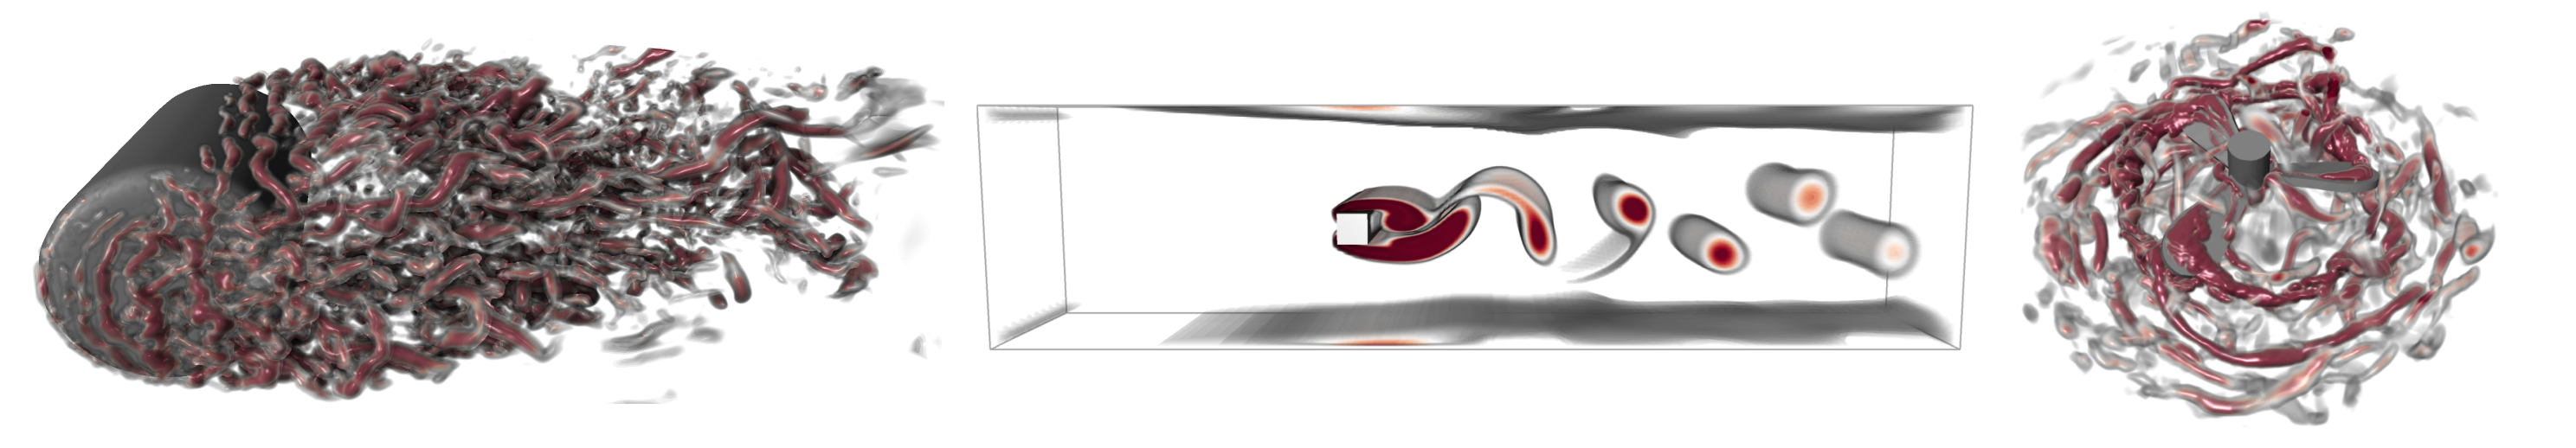
Vortex extraction is among the most challenging tasks of vector field analysis. We investigate elegant optimization-based approaches that extract vortices in an optimal near-steady reference frame. Vortex measures thereby become invariant under initial rotations and translations of the observer, i.e., they become objective.
Visibility Optimization
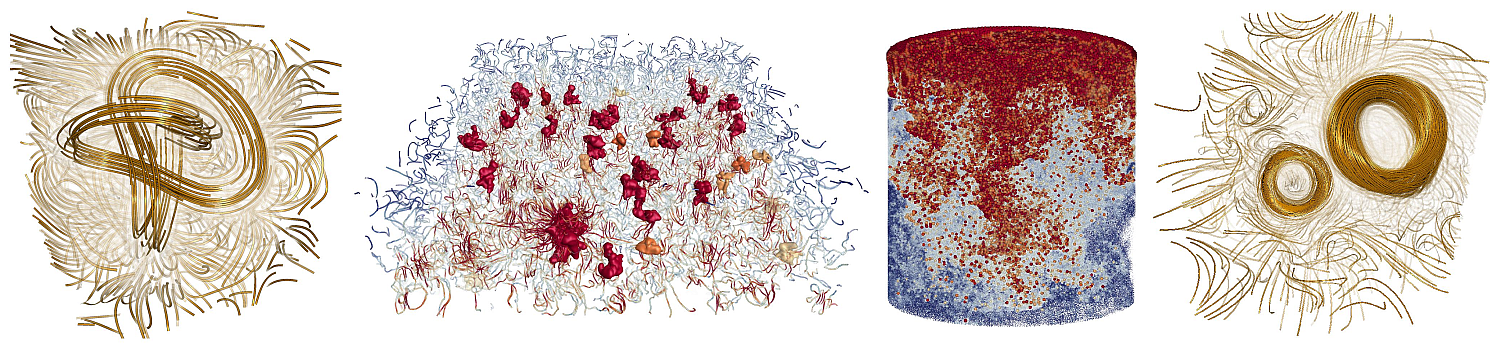
When it comes to 3D flow visualization, we often encounter occlusion problems when displaying dense sets of points, lines or multiple surfaces. A vital aspect is the careful selection of the primitives that best communicate the relevant features in a data set. We investigate optimization-based approaches that adjust the opacity of points, lines and surfaces to strive for a balance between the presentation of relevant information and occlusion avoidance.
Publications
2021
Spatio-Temporal Downscaling of Climate Data Using Convolutional and Error-Predicting Neural Networks
Frontiers in Climate, Frontiers, vol. 3, no. , 2021, pp. 26
Available files: [PDF] [BibTeX] [Abstract]
2020
Implicit Ray Casting of the Parallel Vectors Operator
IEEE Visualization - Short Papers (Virtual, Oct 25-30, 2020), pp. 31-35
Available files: [PDF][PDF suppl.] [Video] [BibTeX] [Abstract]
Coreline Criteria for Inertial Particle Motion
Topological Methods in Data Analysis and Visualization VI, Springer, 2020, pp. 133-157
Available files: [PDF] [BibTeX] [Abstract]
Introduction to Vector Field Topology
Topological Methods in Data Analysis and Visualization VI, Springer, 2020, pp. 289-326
Available files: [PDF] [BibTeX] [Abstract]
Objective Finite-Time Flow Topology from Flowmap Expansion and Contraction
Topological Methods in Data Analysis and Visualization VI, Springer, 2020, pp. 111-31
Available files: [PDF] [BibTeX] [Abstract]
A Fluid Flow Data Set for Machine Learning and its Application to Neural Flow Map Interpolation
IEEE Transactions on Visualization and Computer Graphics (Proc. IEEE Scientific Visualization 2020), IEEE, vol. 27, no. , 2021, pp. 1279-1289
Available files: [PDF][PDF suppl.] [Video] [BibTeX] [Abstract]
Glyph-Based Visualization of Affective States
EuroVis (Norrköping, Sweden, May 25-29, 2020), pp. 121-125
Available files: [PDF][ZIP suppl.] [Video] [BibTeX] [Abstract]
Evolution of an Atmospheric Kármán Vortex Street From High-Resolution Satellite Winds: Guadalupe Island Case Study
Journal of Geophysical Research: Atmospheres, AGU, vol. 125, no. 4, 2020, pp.
Available files: [BibTeX] [Abstract]
Visibility, Topology, and Inertia: New Methods in Flow Visualization
IEEE Computer Graphics and Applications, IEEE, vol. 40, no. 2, 2020, pp. 103-111
Available files: [PDF] [BibTeX] [Abstract]
Vector Field Topology of Time-Dependent Flows in a Steady Reference Frame
Proceedings of IEEE Scientific Visualization (Vancouver, BC, Canada, October 20-25, 2019), IEEE Transactions on Visualization and Computer Graphics, vol. 26, no. 1, 2019, pp. 280-290
Available files: [PDF][PDF suppl.] [Video] [BibTeX] [Abstract]
Accelerated Monte Carlo Rendering of Finite-Time Lyapunov Exponents
Proceedings of IEEE Scientific Visualization (Vancouver, BC, Canada, October 20-25, 2019), IEEE Transactions on Visualization and Computer Graphics, vol. 26, no. 1, 2019, pp. 708-718
Available files: [PDF][PDF suppl.] [Video] [BibTeX] [Abstract]
Extraction and Visual Analysis of Potential Vorticity Banners around the Alps
Proceedings of IEEE Scientific Visualization (Vancouver, BC, Canada, October 20-25, 2020), IEEE Transactions on Visualization and Computer Graphics, vol. 26, no. 1, 2020, pp. 259-269
Available files: [PDF] [Video] [BibTeX] [Abstract]

Objective Finite-Time Flow Topology from Flowmap Expansion and Contraction
TopoInVis 2019: Software and Applications (Nyköping, Sweden, June 17-19, 2019), pp. 1:1-1:20 (Best Paper Award)
Available files: [PDF] [BibTeX] [Abstract]
Fourier Opacity Optimization for Scalable Exploration
IEEE Transactions on Visualization and Computer Graphics, 2019.
Available files: [PDF][PDF suppl.] [Video] [BibTeX] [Abstract]
Robust Reference Frame Extraction from Unsteady 2D Vector Fields with Convolutional Neural Networks
Proceedings of the Eurographics Conference on Visualization (Porto, Portugal, June 3-7, 2019), Computer Graphics Forum, vol. 38, no. 3, 2019, pp. 285-295
Available files: [PDF] [BibTeX] [Abstract]
Correlated Point Sampling for Geospatial Scalar Field Visualization
Vision, Modeling and Visualization (Stuttgart, Germany, October 10-12, 2018), pp. 119-126
Available files: [PDF] [BibTeX] [Abstract]
Parameter Space Comparison of Inertial Particle Models
Vision, Modeling and Visualization (Stuttgart, Germany, October 10-12, 2018), pp. 63-70 (Best Paper Award)
Available files: [PDF] [BibTeX] [Abstract]
Visual Analysis of Aneurysm Data using Statistical Graphics
IEEE Transactions on Visualization and Computer Graphics (Proc. IEEE Scientific Visualization 2018), IEEE, vol. 25, no. 1, 2019, pp. 997-1007
Available files: [PDF] [Video] [BibTeX] [Abstract]
Visualization of Neural Network Predictions for Weather Forecasting
Computer Graphics Forum, Blackwell Publishing, vol. 38, no. 1, 2019, pp. 209-220
Available files: [PDF][PDF suppl.] [Video] [BibTeX] [Abstract]
Visualizing the Phase Space of Heterogeneous Inertial Particles in 2D Flows
Proceedings of the Eurographics Conference on Visualization (Brno, Czech Republic, June 4-8, 2018), Computer Graphics Forum, vol. 37, no. 3, 2018, pp. 289-300
Available files: [PDF] [Video] [BibTeX] [Abstract]
The State of the Art in Vortex Extraction
Computer Graphics Forum, Wiley, vol. 37, no. 3, 2018, pp. 149-173
Available files: [PDF] [BibTeX] [Abstract]
Management of Cerebral Aneurysm Descriptors based on an Automatic Ostium Extraction
IEEE Computer Graphics and Applications, IEEE, vol. 38, no. 3, 2018, pp. 58-72
Available files: [PDF] [BibTeX] [Abstract]
Progressive Monte Carlo Rendering of Atmospheric Flow Features Across Scales
Physical Review Fluids, American Physical Society (APS), vol. 2, no. 9, 2017, pp. 090502
Available files: [PDF] [BibTeX] [Abstract]
Flow-Induced Inertial Steady Vector Field Topology
Proceedings of Eurographics (Lyon, France, April 24-28, 2017), Computer Graphics Forum, vol. 36, no. 2, pp. 143-152 (Honorable Mention Award)
Available files: [PDF][PDF suppl.] [Video] [BibTeX] [Abstract]
2016
Progressive Monte Carlo Rendering of Atmospheric Flow Features Across Scales
Gallery of Fluid Motion Posters, 69th Annual Meeting of the APS Division of Fluid Dynamics (Milton van Dyke Award)
Available files: [PDF] [BibTeX] [Abstract]
Singularities of the Inertial Flow Map Gradient
Vision, Modeling and Visualization (Bayreuth, Germany, October 10-12, 2016), pp. 69-76
Available files: [PDF] [BibTeX] [Abstract]